Stats: Understanding journal metrics and insights
Discover how to effectively utilize Diarly’s journal metrics and insights to enhance your journaling practice. This guide will help you understand and use Diarly’s features to analyze your journaling habits, set realistic goals, and track your progress.

Accessing stats in Diarly
On iPad and Mac
- Select Stats in the sidebar.
On iPhone
- Tap More in the Tab Bar.
- Then, choose Stats.
Understanding journal metrics
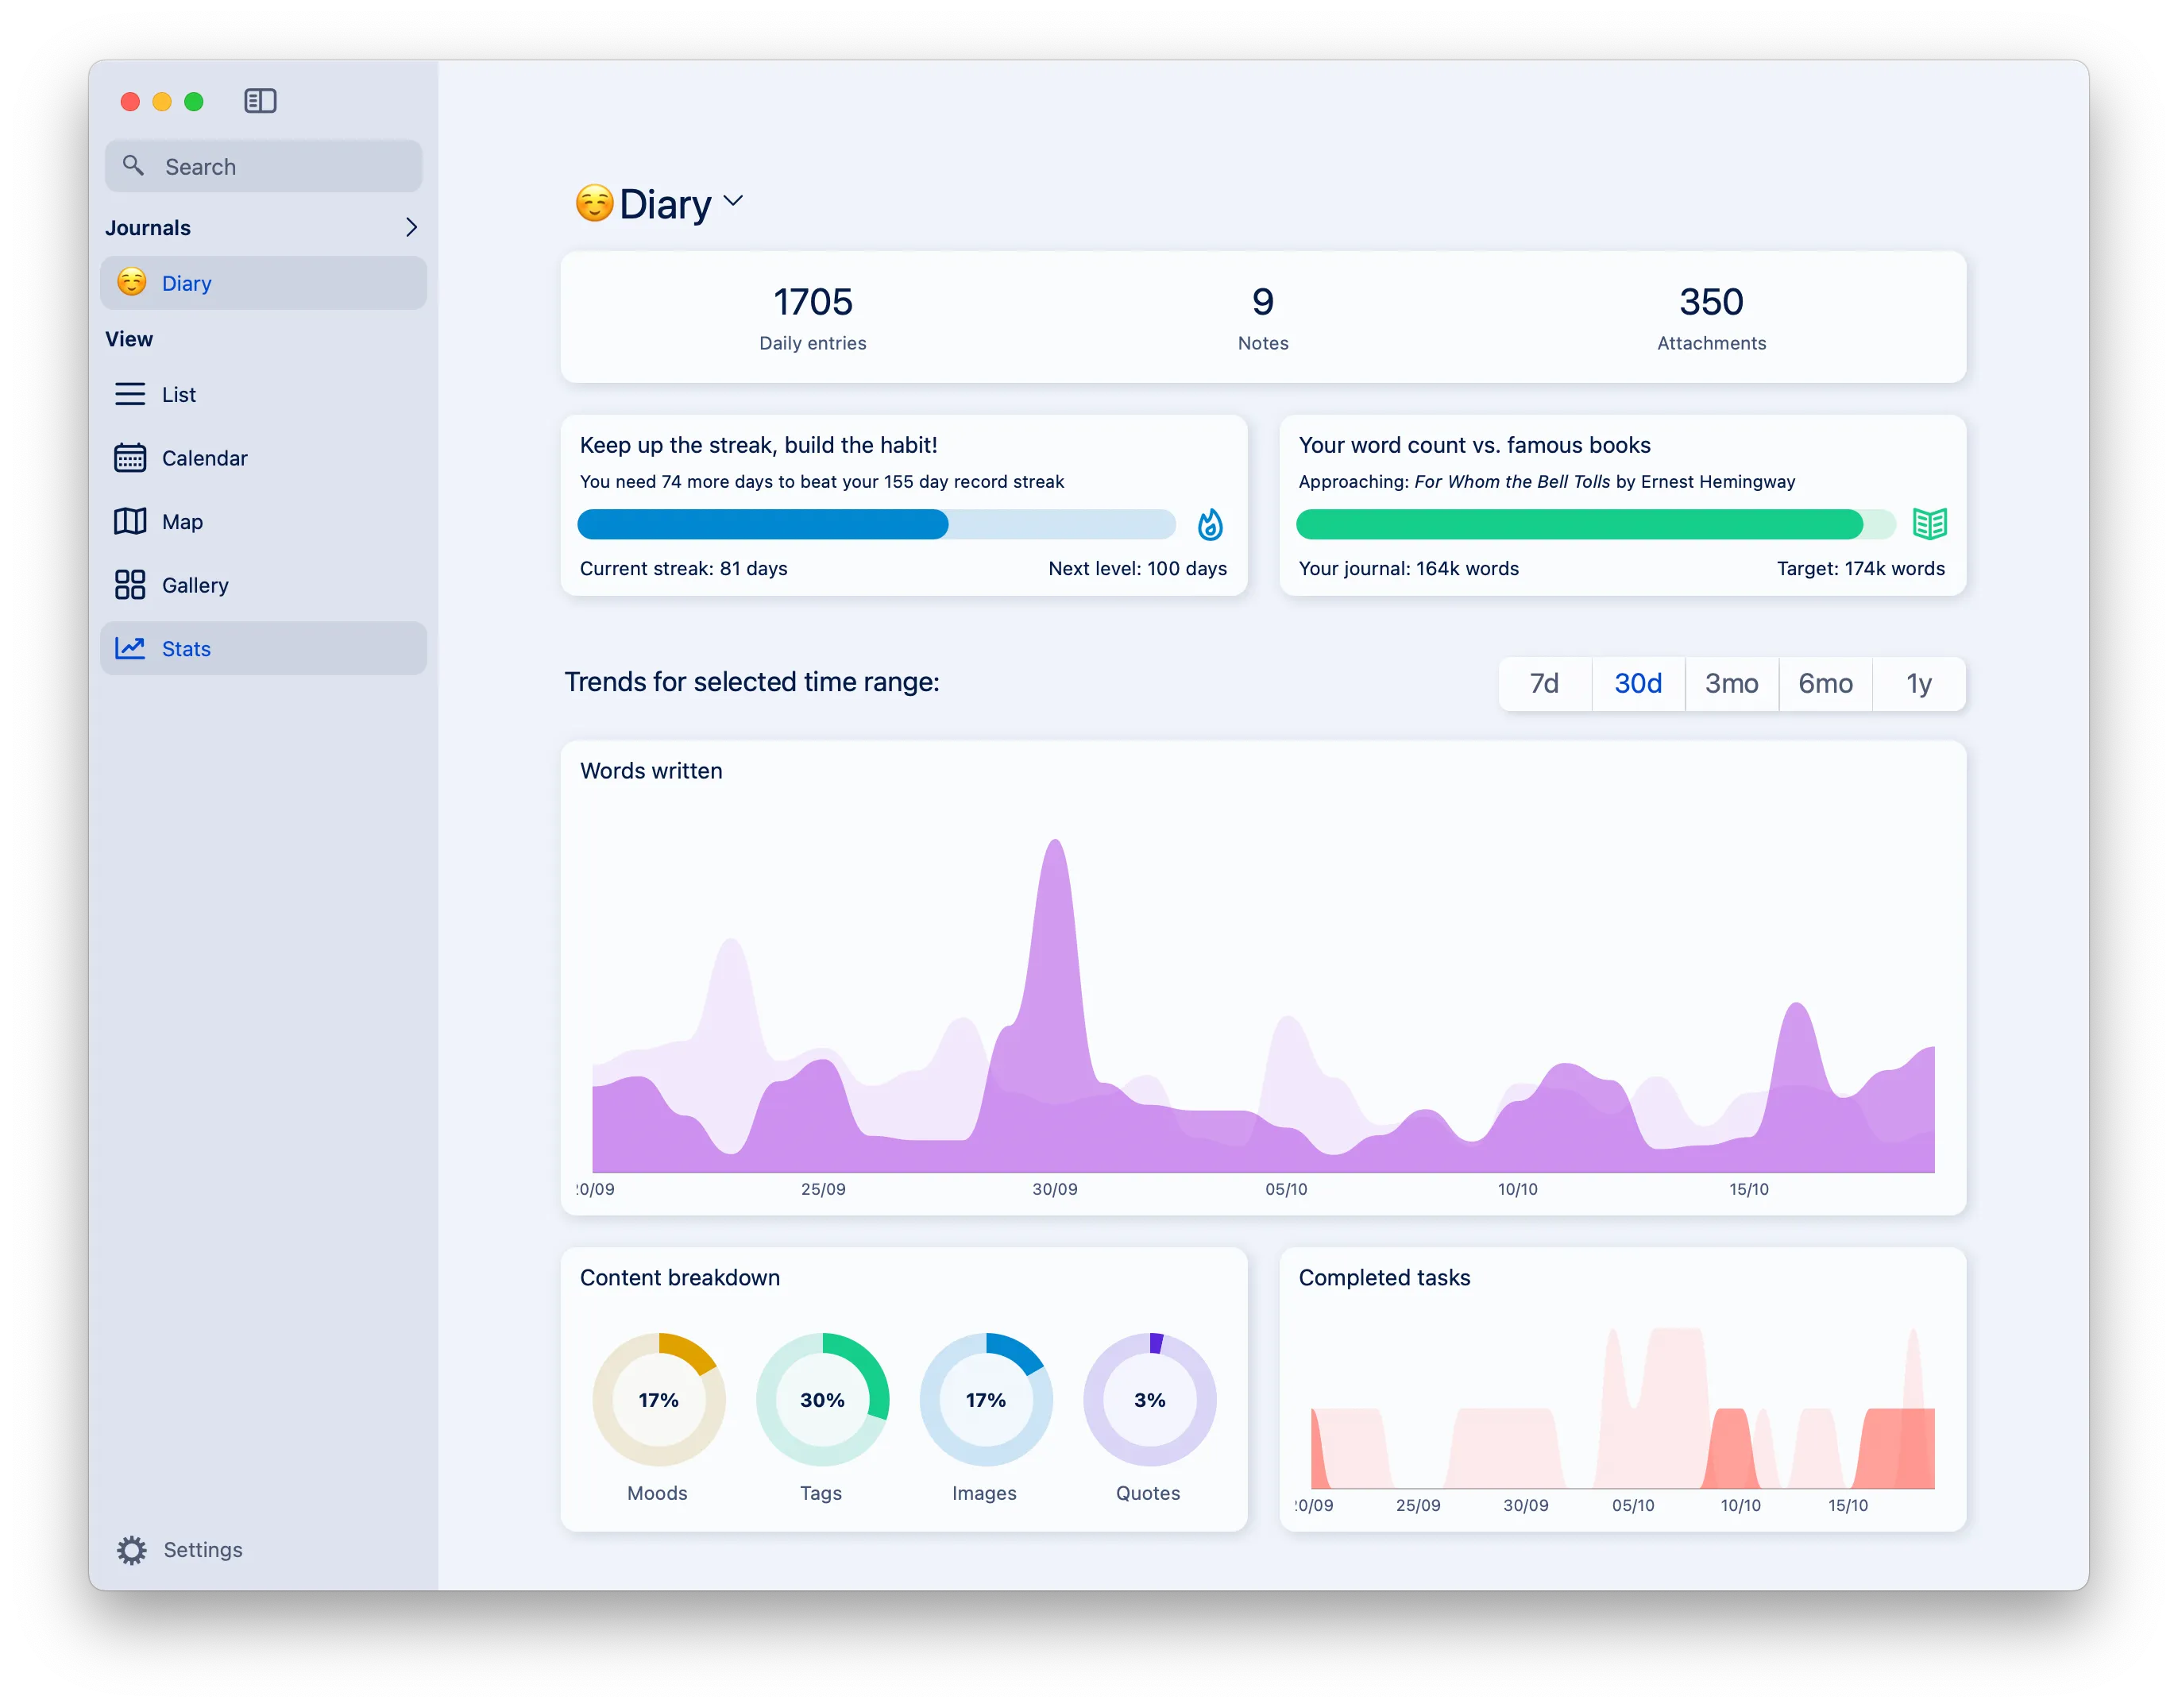
Journal metrics offer a quick overview of your activities.

- Daily entries: Number of journal entries added in the timeline or calendar.
- Notes: Count of notes created.
- Attachments: Total of attachments across your journal.
Streak information
Keep track of your writing consistency:
- Your current active streak.
- Your longest streak to date.
Missed a day? Fill in past entries using the calendar to maintain your streak.
Word count
See how your journal’s word count compares to famous books. Click on a book title for more information about it on Wikipedia.
Analyzing journal trends
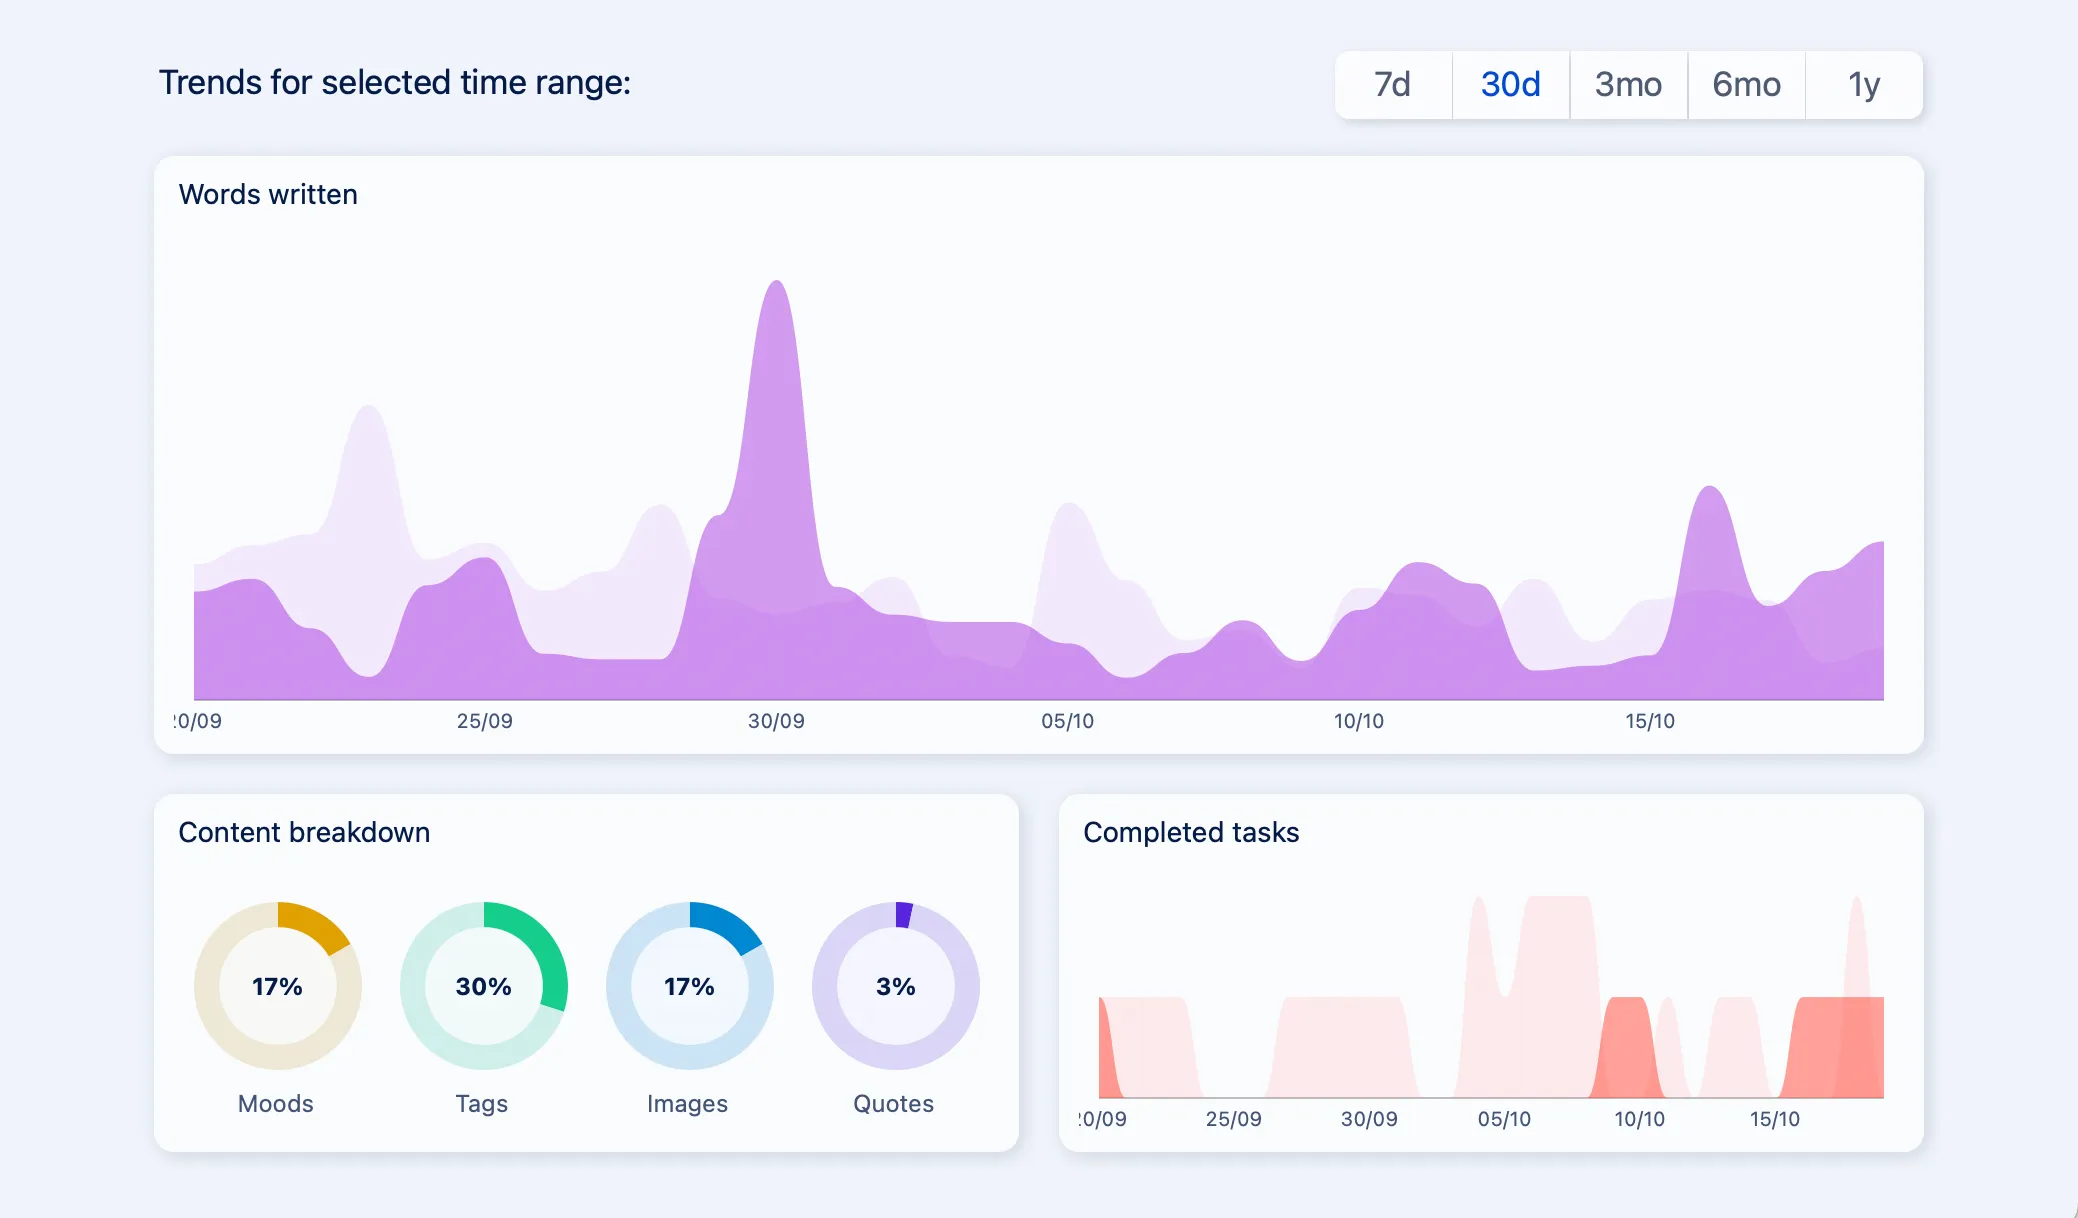
Journal trends provide a detailed analysis over time.

Note: Trends are based on entries; notes are not included. Understand the difference between entries and notes.
Words written
Track your word count across different time frames using the interactive graph. Click on days to view entries for that period.
A glance at your most frequent feelings
Shows the feelings you’ve logged most often over a chosen period. The more you use a feeling, the bigger it appears in the display.
Mood Chart
Each mood entry is represented by a dot on the chart. If you have multiple mood entries in a day, a gradient bar will display, showing the range of moods you experienced.
Content breakdown
Pie charts show the daily percentage of notes with badges, tags, images, and quotes.
Completed tasks
See your task completion rates. Click on numbers to view corresponding entries.
For feedback or support, reach out to us via email, Twitter, Facebook Messenger, Instagram, or on Reddit.